As many know, Event Tracing for Windows (ETW) is a telemetry mechanism commonly used for debugging and security logging. Logging is leveraged by user-mode and kernel-mode applications. In this blog, I will talk briefly about ETW components and how these components can be leveraged for offensive communications. However, for ETW internals I highly suggest reading the following two blogs, as they are the best out there for breaking down ETW Internals to date:
- ETW internals for security research and forensics by Yarden Shafir
- Tampering with Windows Event Tracing: Background, Offense, and Defense by Matt Graeber
I also suggest reading Matt Hand’s book “Evading EDR” where he covers ETW very well, specifically chapter 8.
ETW Components
There are 4 main components within ETW:
- Provider - Software in charge of emitting events.
- Consumer - Software that receives events written to a trace session.
- Event Trace Session - records events from ETW provider(s) and stores them within buffers.
- Controller - Software that controls (start, stop, and define) trace sessions.
There are 4 different types of ETW providers:
It is well known that Windows relies on ETW quite a bit under the hood for debugging or exposing security-related information. For example, if someone goes and examines a Microsoft binary, there is a high likelihood that ETW functions are being used. Most commonly, Microsoft binaries leveraging ETW functions are providers emitting events, such as amsi.dll. There are built-in Microsoft consumers within the OS, for example, the Event Viewer. The Event Viewer is partially a big ETW consumer because all default events exposed through the application are backed by ETW providers/trace sessions. We can see this by leveraging Logman to look at the currently running event trace sessions.
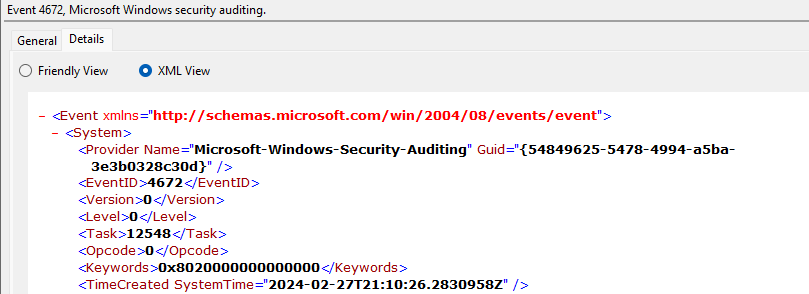
You can also go into a specific log, say the Security log, and you can see that it is backed by the Microsoft-Windows-Security-Auditing provider.

You will also find that security vendors will register their own ETW providers, commonly TraceLogging or Manifest, to write their own events.
To date, most research done with ETW has been defensive-based. However, due to the nature of how ETW works under the hood, there is also a lot of offensive potential. If you think about ETW in its most basic functionality, ETW is just another interprocess communication mechanism (IPC). Unlike other IPC mechanisms, such as named-pipes, ETW is limited to local communication.
Below, I will show the initial offensive research idea and methodology, followed by a video of it working. I will not be sharing code; it will be entirely up to the reader if someone wants to replicate this and weaponize it. There are a lot of great resources out there on how to create an ETW provider. I will be using TraceLogging for this POC, but my JonMon code has examples of how to set up a Manifest-based provider.
The Idea
If defensive communications can be sent through ETW, why can’t offensive communications?
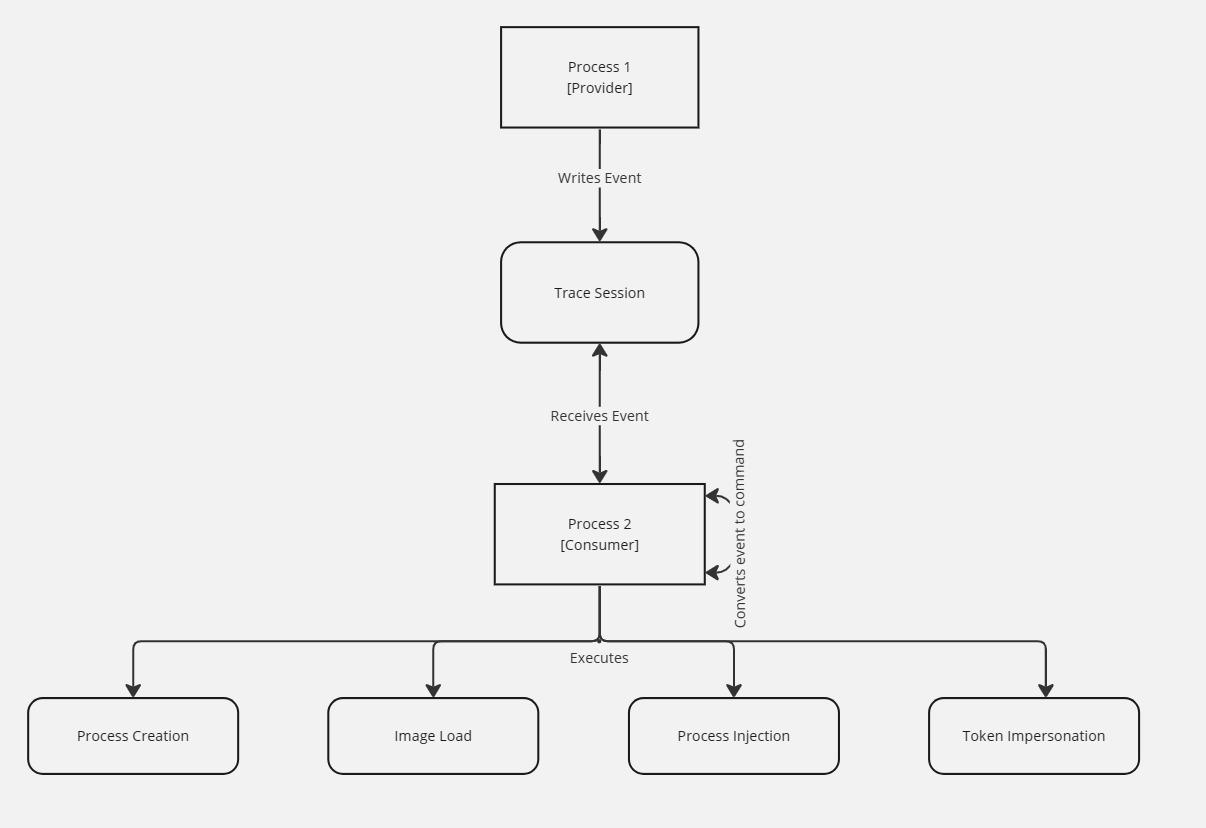
For this to work, someone would need to get their server (consumer) code to run as a privileged user - via a service, token impersonation, process injection, etc. It doesn’t matter how they get their code running in an elevated context, but they will need that to create a trace session. The consumer will also be the component in charge of taking the commands from the client (provider) process and executing the actions it requests.
Next, someone would take the client (provider) code, register the provider, and emit events so the consumer application can take the commands and execute the requests. The provider doesn’t have to run as an elevated process, but every action will run in the context of the consumer application. The flow would look like the following:

One thing to note: ETW is asynchronous, meaning that you can’t receive validation that the action you desired took place. However, someone could create another event for return values and have the provider binary consume those values.
In the video below, you will see an example of the POC working. The consumer is a service binary running under the service name “Msft-Update.” Once it is created, it will create an event trace session called: “Msft-SenseIR.” After this, the consumer is ready to receive events from the provider. This is done through the ETWProvider.exe application, where I am sending the command “ProcessCreate” with the argument “cmd.exe” to state which process to create.
Defensive Guidance
In all honesty, I came across this capability about a year ago. I was reluctant to release this because there isn't a great way to detect the registration of providers on the OS today. There is an ETW provider - Microsoft-Windows-Kernel-EventTracing - with an event (ID 8) specifying when an ETW provider is registered. Still, during testing, I found that when I ran a trace for about 5 seconds, that single event ID produced 109 events. This makes sense given how many different types of providers are running on the OS today. For someone to use this for detection, they would need to build a strategy around identifying known providers registered on the system and removing those from the detections. This is a lot of effort and will almost certainly result in many false positives. Alternatively, one could look at events 10 & 11 to see when a trace session is started and stopped. The noise from these events would be less significant. There are some artifacts a defender could potentially look for:
- For Manifest providers, a resource DLL needs to be created/dropped on disk.
- For MOF providers, a .mof file and a DLL will be dropped to disk.
Outside of that, there isn't a lot. You will still see telemetry for the consumer's various actions - injection, process creation, etc.
Wrapping Up
About a year ago, I decided to look into some offensive use cases for ETW. Leveraging ETW as an IPC mechanism is just one example of the capabilities.
There are three significant limitations to using ETW as an IPC for offensive communications:
- You cannot communicate across machine boundaries.
- Administrator privileges or higher are needed to create an ETW trace session.
- Communication is asynchronous, so someone must set up a way to validate that commands were executed successfully.
However, the upside is that there isn’t a great way to detect communications going over ETW.
Again, no proof-of-concept will be released. There is plenty of documentation out there if someone wants to replicate this. Please reach out with any questions.


.jpg)

.png)