BLUF
We detected a prominent LockBit encryptor using hardware-based execution telemetry, which generated multiple alerts as it escalated privileges, encrypted files, and executed a secondary cleanup tool to conceal its tracks. These detections did not rely on specific patterns of file encryption or any static indicators that would require prior knowledge of this family of malware.
Instead, the Prelude agent identified an unusual, but widely employed, approach to invoking Win32 API methods in a way that evades common signature-based detection strategies and manual analysis methods. The context collected by the agent yielded a large set of easily recognizable indicators, making it easy to identify the sample as a ransomware encryptor.
This post discusses the inner workings of this encryptor, why it executes private memory, what the resulting Prelude notifications look like, and how we can work our way back from anomalous memory execution to construct a thorough narrative of a system compromise leading to ransomware.
Our whitepaper on out-of-context execution primarily focused on detecting loaders and injection-type behaviors, but this strategy of detecting out-of-context execution extends far beyond these basic use cases. One example we encountered during our testing is the LockBit 3.0 encryptor, first observed in 2022 (MD5: 9b309cd7a3c63cf9ed694f37207d8958).
While this sample is known to primarily prepare the system and carry out the encryption stage of the ransomware lifecycle, it also uses private memory in a unique way that enables our detection strategy to catch ransomware before the encryption stage.
Detection strategy recap
One of the core detection strategies employed by the Prelude agent is straightforward: it detects any execution of private memory, regardless of the mechanism used to trigger that execution. We instrument this approach through a combination of Last Branch Record (LBR) telemetry and a subset of events emitted via the Threat Intelligence ETW provider (EtwTI). The specifics of our telemetry collection strategy are beyond the scope of this post, but our whitepaper includes a detailed description of how an ETW trace session can be configured to collect LBR telemetry in response to the generation of arbitrary ETW events.
Given the simplicity of our detection logic, identifying the root cause of a true positive detection involves answering three questions:
- How was the private memory allocated?
- How was it executed?
- Does this execution make sense contextually?
The answers to these questions establish the provenance of the allocated memory region and the execution attempt itself. The concept of provenance is crucial because it determines whether a given execution attempt makes sense in context.
Why does this sample execute private memory?
There isn’t an obvious reason for an encryptor to allocate private memory and execute code there. That behavior is more typical of an initial loader or a C2 agent that stages post-exploit tooling in memory. What we see instead appears to be the encryptor using virtual memory as storage for a supporting function-resolution mechanism. Public reporting provides a quick hypothesis for this behavior, and the telemetry we observed lets us validate it.
Multiple analyses of LockBit 3.0 indicate a specific method of loading native Windows modules and resolving common Win32 APIs that was borrowed from earlier versions of the BlackMatter encryptor. In a typical application, these modules and functions would be referenced through the PE’s Import Address Table (IAT). The author of this encryptor avoided adding explicit IAT imports, likely to reduce obvious artifacts that static scanners and simple string searches can identify. It is important to note that this obfuscation does not eliminate telemetry emitted via ETW inside the functions themselves, nor kernel callbacks. Its primary value is simply to remove the clear-text strings and IAT entries that make static detection trivial.
Reviewing public analyses of the LockBit and BlackMatter encryptors alongside our sample shows that this loader/resolver uses private memory to hold references to the functions it wants to call. At its core, it implements a multi-step LoadLibrary/GetProcAddress pattern: walk kernel32.dll’s export table, hash module and function names, locate the addresses of LoadLibrary and GetProcAddress, then use them to load additional DLLs and resolve desired API entry points. Because kernel32.dll is already resident in every process, this export-walking approach avoids explicit imports.
The important twist is that the resolved functions are never referenced directly. Instead, the encryptor constructs small trampoline stubs in heap memory that transfer control to the real function addresses, effectively building a trampoline-based runtime jump table. The encryptor then calls these heap-resident stubs rather than issuing calls against raw function pointers or embedding unobfuscated API names. This indirection ensures that a simple memory scan won’t reveal references like “CreateFileW” directly; the mapping exists only through the intermediate heap stubs. The branching instructions into those stubs are what generated the telemetry analyzed earlier, and the initial state of this trampoline-based jump table is illustrated below.

At runtime, the encryptor stores pointers to those trampoline entries and calls them when it needs to invoke an API. In other words, instead of calling an API directly, the encryptor performs `CALL <trampoline_address>`, the trampoline executes a `JMP` (or `CALL`) to the actual resolved API entry, and control is then transferred. The control-flow sequence produced by this indirection is shown below.

The Prelude agent identified that private memory was allocated and executed, but also described the context in which these operations occurred as a graph.
What we saw
The above video shows our initial view of one of the notifications generated by the LockBit 3.0 sample we analyzed. The name of the notification, “In-Memory Execution from Last Branch Record detected,” indicates that the Prelude agent observed execution of an instruction in private memory through a Last Branch Record event.
To determine if this execution should be considered out of context, we need to identify the provenance of this virtual memory region and the threads that interacted with it. The Prelude agent collects and evaluates the telemetry needed to determine how a memory allocation came to exist on the system, both in terms of the objects that existed before it and contributed to its creation, as well as the control flow that led to its execution.
How was the private memory allocated?
We already know why the private memory was allocated based on prior analysis of the sample itself, but the graph also shows us how the allocation occurred.
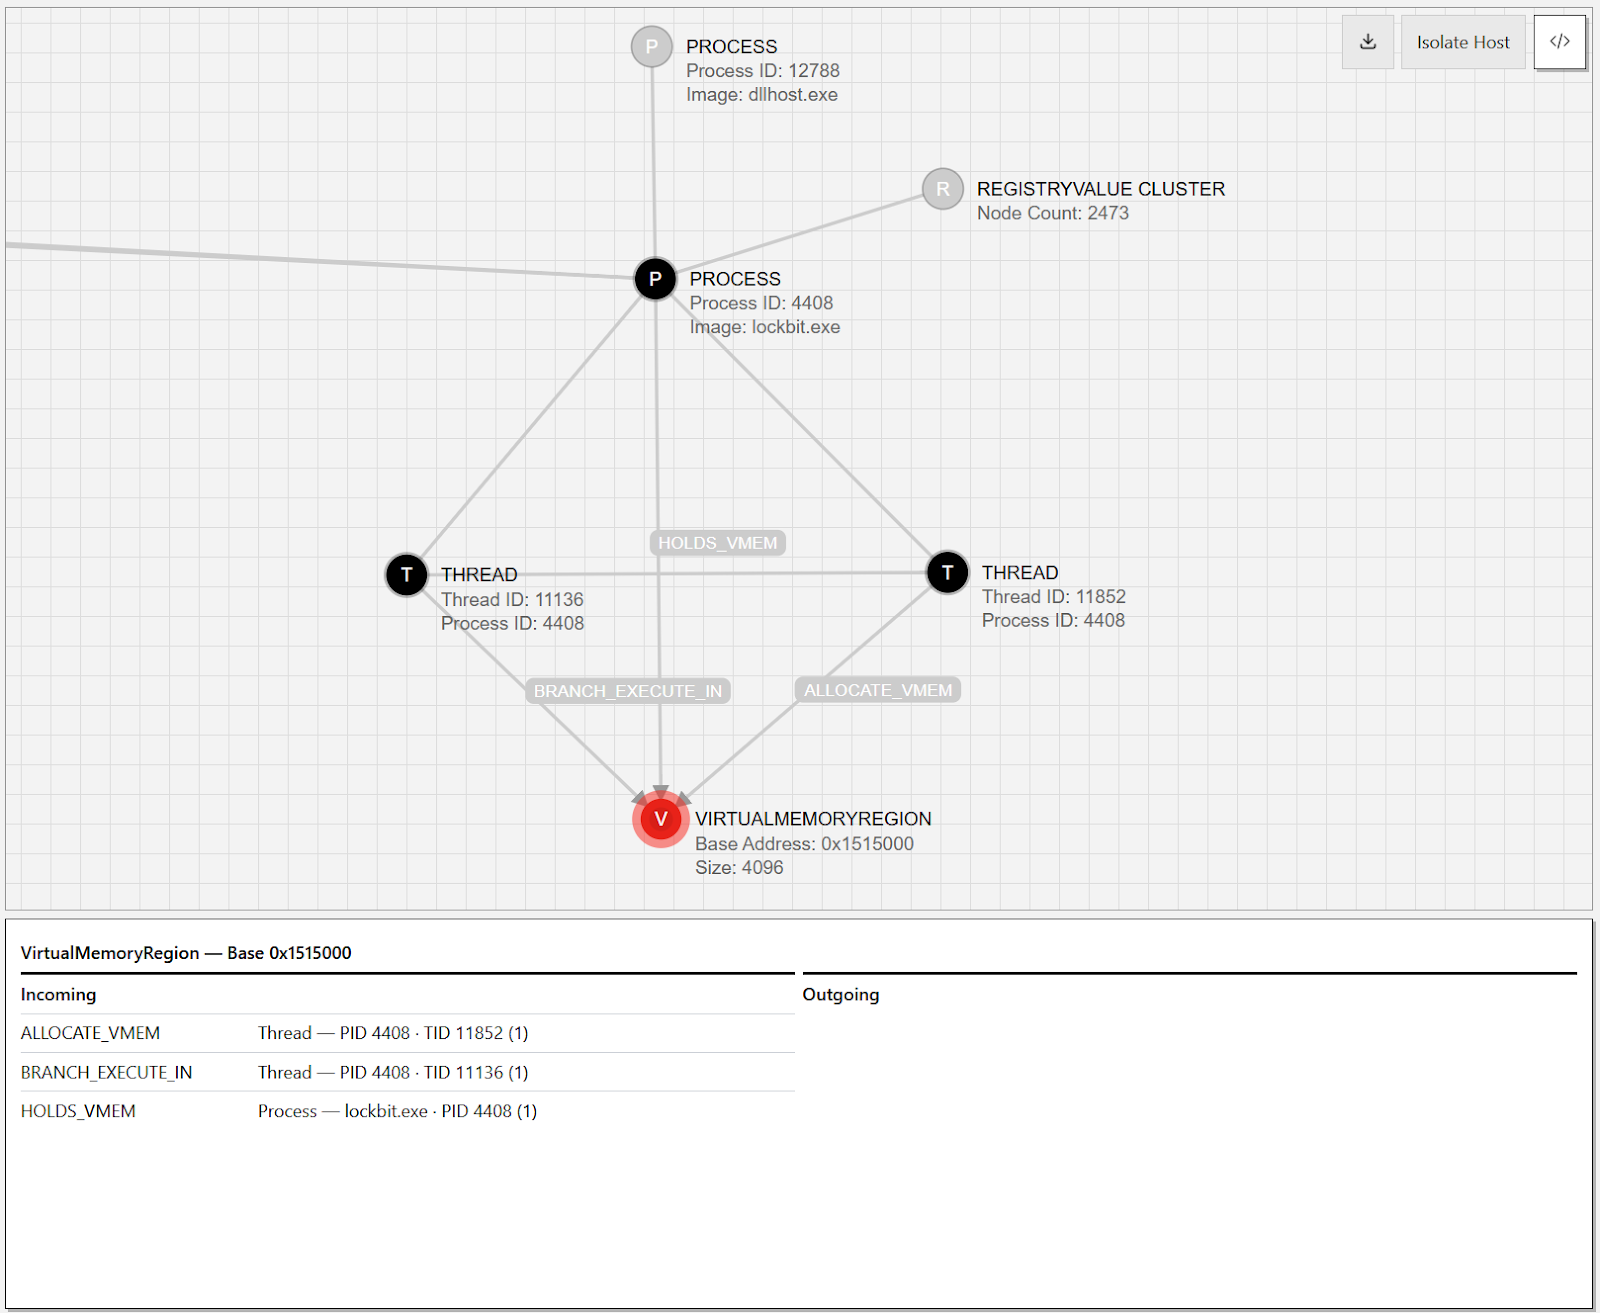
Nodes in the graph are hierarchical and have clear paths to other nodes that created them, established by the presence of specific labeled edges. The notification metadata on the left-hand side of the graph provides basic details about the process where the execution took place, the thread that executed private memory, and the region of private memory where the execution took place.
The sole `VirtualMemoryRegion` node in the graph, highlighted in red, is the starting point for our investigation. We know that this virtual memory was initially allocated with a protection constant of `PAGE_EXECUTE_READWRITE` (0x40) based on the `protection_mask` property in the `VirtualMemoryRegion` node.

The `ALLOCATE_VMEM` edge tells us which thread was responsible for allocating the memory, and the `HOLDS_VMEM` edge tells us that a given virtual memory region belongs to a specific process.
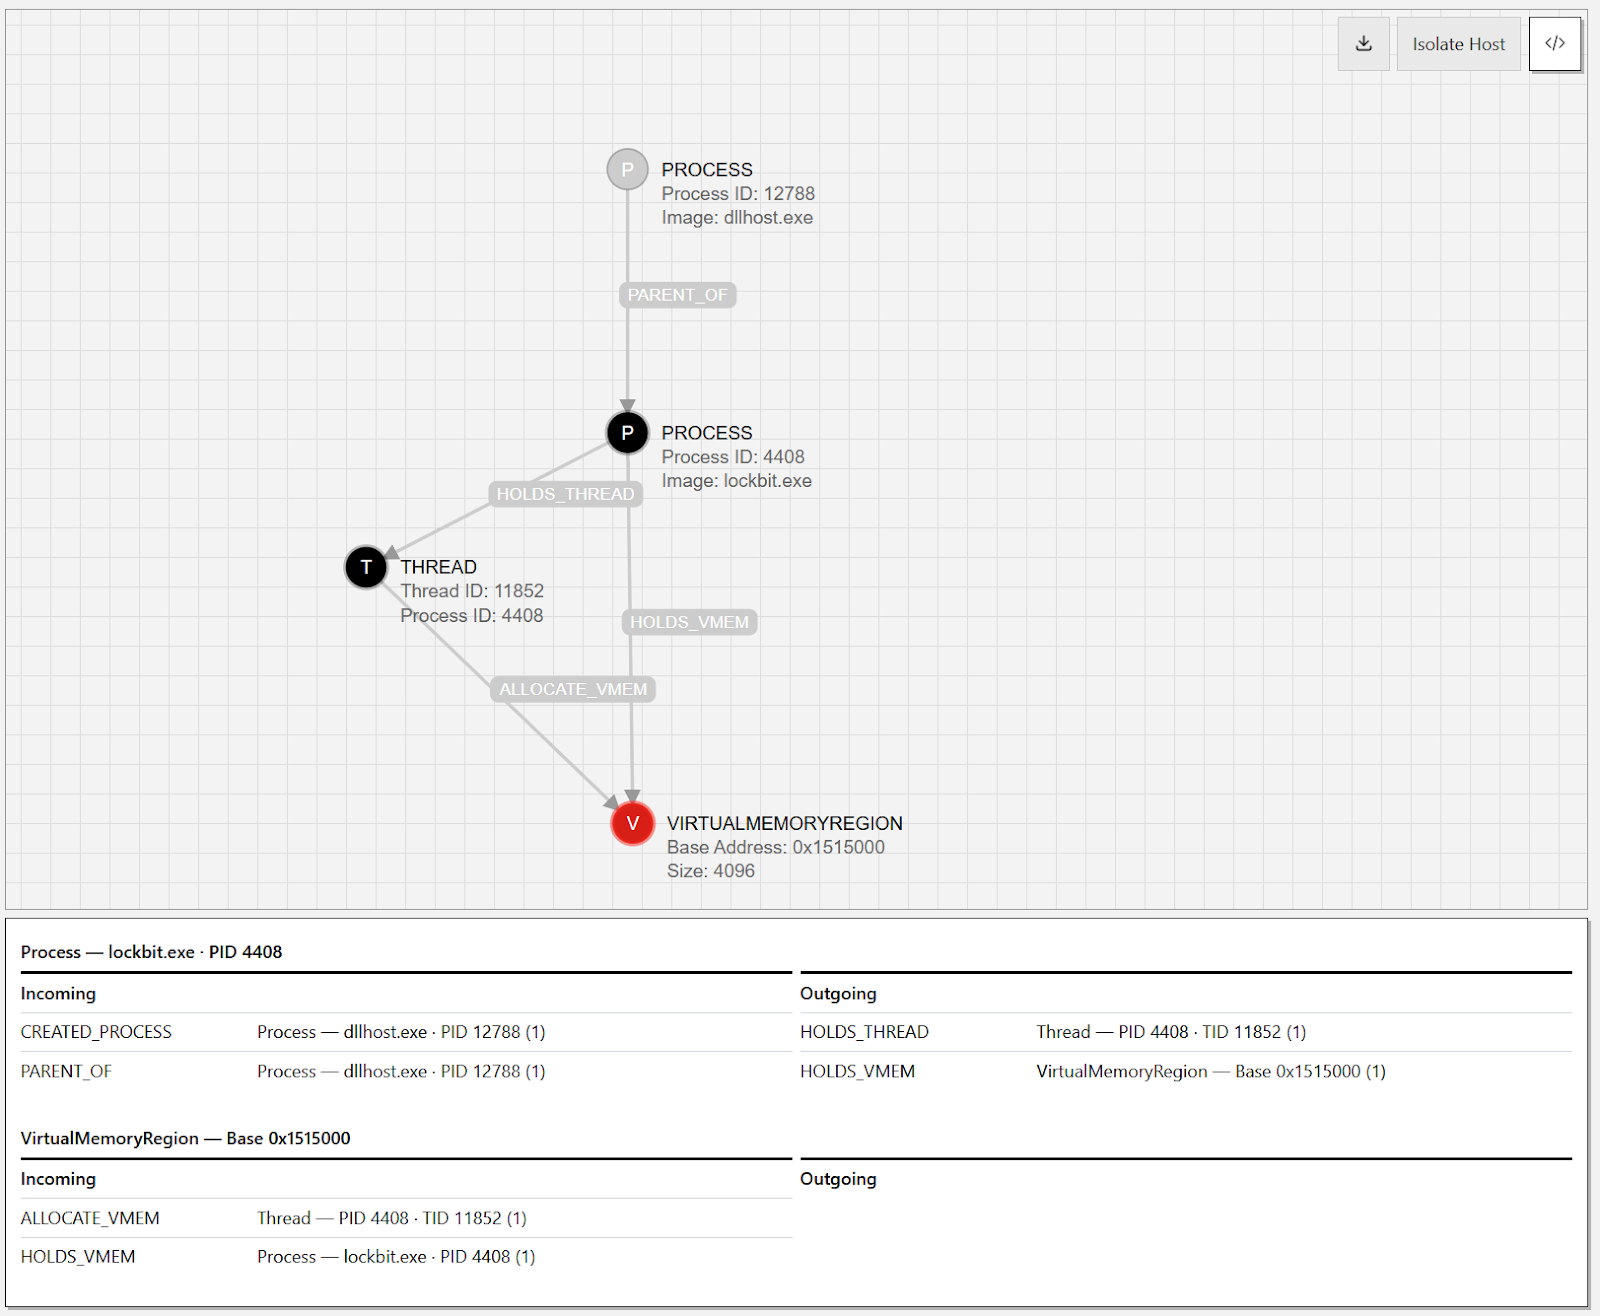
The `ALLOCATE_VMEM` edge gives us our first level of object provenance by identifying a specific thread (TID 11852) as the caller of `ntdll!NtAllocateVirtualMemory`. We can also identify the owner of this thread by following the `HOLDS_THREAD` edge to the `lockbit.exe` process node (PID 4408). Similar to memory allocation, there are distinct edges for `CREATES_THREAD` and `HOLDS_THREAD` because threads can create new threads across processes. In this case, the existence of only the `HOLDS_THREAD` edge means that the thread (TID 11852) was created by an existing thread in the `lockbit.exe` process and that the existing thread had no other relevance to the notification.
We can also move up the process hierarchy to consider the provenance of the `lockbit.exe` process itself by following the `PARENT_OF` edge connecting the `dllhost.exe` and `lockbit.exe` `Process` nodes. This parent process was an instance of dllhost.exe with a particularly odd command line argument that suggests this sample implemented a common UAC bypass seen in other ransomware campaigns and malware samples.
"command_line": "C:\\WINDOWS\\SysWOW64\\DllHost.exe
/Processid:{3E5FC7F9-9A51-4367-9063-A120244FBEC7}"
Using the timeline reconstruction feature in the UI and pausing at the time that the allocation occurred, we can see a clear through-line of object creation from the dllhost process:
How was the private memory executed?
The remaining `BRANCH_EXECUTE_IN` edge indicates that thread 11136 followed a branching instruction, which resulted in the application executing private memory. Based on our previous discussion of the sample, this is likely the `CALL` instruction that redirects execution to the jump table constructed on the heap, before following a `JMP` to the address of the Win32 API function specified by the caller. LBR events provide the to/from address pairs of (up to) the last 32 branch instructions executed by a given thread, giving us crucial insights into how private memory was executed. After enriching this data with module and function symbols, we use it to identify known false positives at scale, but it is also helpful for alert triage and investigation.
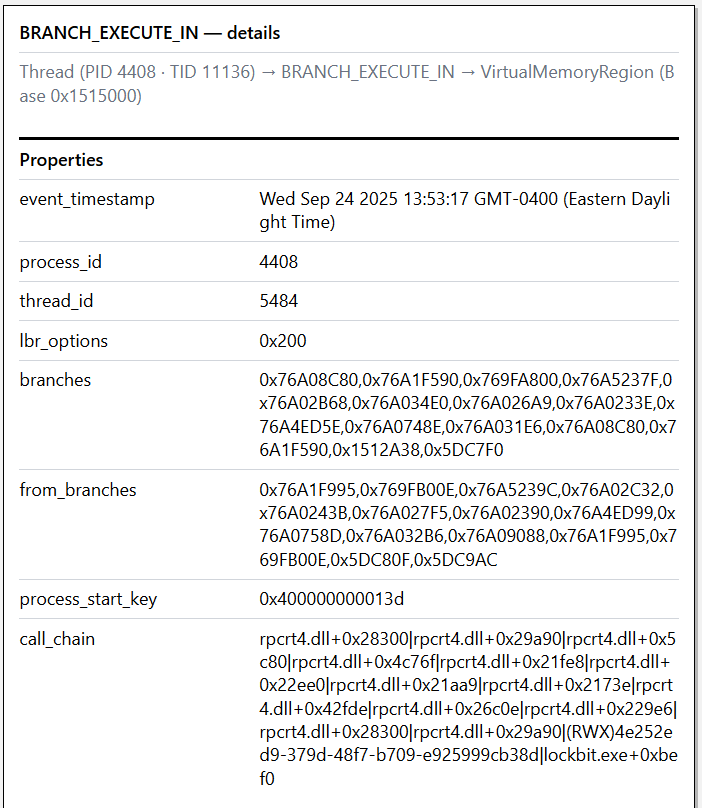
The Prelude agent resolves the complete set of 32 branching instructions executed by a thread in response to scheduled Performance Monitor Interrupt (PMI) events triggered by the agent. This approach provides an opportunistic summary of the control flow that led to the execution of private memory. If any of these addresses are located in a virtual memory region that is not backed by an image on disk (i.e., private memory), the Prelude agent will generate a notification similar to the one we are investigating. A fully resolved execution call chain for this LockBit sample is shown below; however, the exact symbols will vary between runs because PMI is an opportunistic, scheduled inflection point for inspecting a given thread.
rpcrt4!LRPC_BASE_BINDING_HANDLE::DriveStateForward|
rpcrt4!LRPC_BINDING_HANDLE::NegotiateTransferSyntax|
rpcrt4!NdrClientCall2|
rpcrt4!ept_map_auth|
rpcrt4!EP_LOOKUP_DATA::LookupNextChunk|
rpcrt4!RpcBindingSetAuthInfoExW|
rpcrt4!BindToEpMapper|
rpcrt4!EP_LOOKUP_DATA::ResolveEndpoint|
rpcrt4!ResolveEndpointWithEpMapper|
rpcrt4!LRPC_BASE_BINDING_HANDLE::SubmitResolveEndpointRequest|
rpcrt4!LRPC_BASE_BINDING_HANDLE::ResolveEndpoint|
rpcrt4!LRPC_BASE_BINDING_HANDLE::DriveStateForward|
rpcrt4!LRPC_BINDING_HANDLE::NegotiateTransferSyntax|
(RWX)PRIVATE_MEMORY|
Lockbit.exe+0xbef0
The above example should be read from bottom-up and interpreted as a thread invoking an RPC procedure after execution moves from the lockbit.exe image itself, into private memory, and then into a series of calls related to establishing a connection with an RPC server, before eventually invoking a procedure via `rpcrt4!NdrClientCall2`. Given our understanding of the LockBit encryptor sample analyzed here, this likely represents a call into heap memory where the trampoline stubs are placed, followed by a jump to the beginning of a function that, in turn, invokes an RPC procedure. Many Win32 API functions are little more than wrappers for invoking specific procedures exposed by an RPC interface.
Although the specific RPC interface that the thread is interacting with is not explicitly revealed in this data, it still serves several important purposes. For the agent, LBR event addresses resolve to specific images in memory, building a fingerprint of the usual behavior of long-running processes that provides a powerful analytic tool for identifying novel executions of private memory. As we expose the agent to more diverse environments, we can build extremely robust profiles of the typical paths of execution for specific images. For customers, resolved call chains provide invaluable context about why and how private memory was executed.
In the future, we plan to combine resolved call chains with our understanding of the types of telemetry generated by specific operations. By defining the types of events we expect to see when a client invokes an RPC procedure, we can further characterize the behavior of a specific thread around the time of execution.
Is this private memory execution out of context?
So far, we have discussed why the LockBit encryptor generated a Prelude notification; however, we have not yet explored how to distinguish between benign and malicious instances of private memory execution. The single notification we have been analyzing so far is actually a small part of the overall picture, kept isolated from the other notifications related to the encryptor sample for simplicity’s sake. In reality, the Prelude agent actually detected dozens of distinct executions of private memory resulting from this sample. Because PMI is opportunistic and was the sole source of execution telemetry in the agent build used for the example data in this post, the exact number of notifications fluctuated between runs; however, it never went undetected. In a customer environment, all of these notifications would have been presented together.
The primary objective of our detection strategy is to surface novel executions to analysts and provide sufficient additional information about the nature and behavior of the system objects associated with that execution, informing a decision about whether it is out of context. This allows us to be less reliant on an endless series of rules that form brittle state machines with unknown collective efficacy. After reviewing all of the separate execution attempts observed by the agent, they can be divided into three categories:
- Encryptor Process A – The initial, manual execution of lockbit.exe with a token that is not part of the local administrators group
- Detected repetitive calls into the heap jump table for Win32 APIs
- The sample attempts a UAC bypass that starts a `dllhost.exe` process and a new instance of `lockbit.exe` with a more privileged token
- Encryptor Process B - The second instance of `lockbit.exe` with a more privileged token, created by a `dllhost.exe` process resulting from a successful UAC bypass attempt by Process A
- Detected repetitive calls into the heap jump table for Win32 APIs
- The sample writes a PE file with a `.TMP` extension that deletes the encryptor
- Cleanup Process - The cleanup PE was written and executed by Encryptor Process B
- Detected repetitive calls into the heap jump table for Win32 APIs


All three of these processes generated alerts because they used the same dynamic image loading technique, which repetitively jumped between heap memory and image-backed memory, where specific modules were loaded. This type of behavior is rarely observed outside of specific scenarios, such as JIT compilation, the signs of which were not observed in these processes. We can analyze recent branches taken by each thread when it executed private memory to confirm the overall pattern that we believe is occurring. The strings below represent a small selection of significant call stack strings across several runs of the encryptor:
Instance 1:
rpcrt4!LRPC_BASE_BINDING_HANDLE::DriveStateForward
|rpcrt4!LRPC_BINDING_HANDLE::NegotiateTransferSyntax
|rpcrt4!NdrClientCall2
|rpcrt4!ept_map_auth
|rpcrt4!EP_LOOKUP_DATA::LookupNextChunk
|rpcrt4!RpcBindingSetAuthInfoExW
|rpcrt4!BindToEpMapper
|rpcrt4!EP_LOOKUP_DATA::ResolveEndpoint
|rpcrt4!ResolveEndpointWithEpMapper
|rpcrt4!LRPC_BASE_BINDING_HANDLE::SubmitResolveEndpointRequest
|rpcrt4!LRPC_BASE_BINDING_HANDLE::ResolveEndpoint
|rpcrt4!LRPC_BASE_BINDING_HANDLE::DriveStateForward
|rpcrt4!LRPC_BINDING_HANDLE::NegotiateTransferSyntax
|(RWX)4e252ed9-379d-48f7-b709-e925999cb38d
|lockbit.exe+0xbef0


Instance 2:
(RWX)4e252ed9-379d-48f7-b709-e925999cb38d|lockbit.exe+0x56f8|lockbit.exe+0xe214|(RWX)7e80b580-8922-4680-9568-b1d382e4f7c3|lockbit.exe+0xe1cc


Instance 3:
(RWX)4e252ed9-379d-48f7-b709-e925999cb38d|lockbit.exe+0x56f0|lockbit.exe+0xec8c


Instance 4:
(RWX)4e252ed9-379d-48f7-b709-e925999cb38d|lockbit.exe+0x56f0


Instance 5:
rpcrt4!LRPC_BASE_BINDING_HANDLE::DriveStateForward|
rpcrt4!LRPC_BINDING_HANDLE::NegotiateTransferSyntax|
rpcrt4!NdrClientCall2|
rpcrt4!ept_map_auth|
rpcrt4!EP_LOOKUP_DATA::LookupNextChunk|
rpcrt4!RpcBindingSetAuthInfoExW|
rpcrt4!BindToEpMapper|
rpcrt4!EP_LOOKUP_DATA::ResolveEndpoint|
rpcrt4!ResolveEndpointWithEpMapper|
rpcrt4!LRPC_BASE_BINDING_HANDLE::SubmitResolveEndpointRequest|
rpcrt4!LRPC_BASE_BINDING_HANDLE::ResolveEndpoint|
rpcrt4!LRPC_BASE_BINDING_HANDLE::DriveStateForward|
rpcrt4!LRPC_BINDING_HANDLE::NegotiateTransferSyntax|
(RWX)PRIVATE_MEMORY|
Lockbit.exe+0xbef0
Taken together, there is a clear pattern of transitions from private memory regions into images associated with IPC mechanisms (RPC, COM) and system calls. Since LBR is not a complete inventory of every instruction taken by a thread, it is often necessary to overlay knowledge of the way that Win32 APIs are organized to use them to infer a thread’s actions. However, combined with additional analysis about the relevant virtual memory region and the ways the threads interact with it, we can develop robust profiles of common false positives that stand in contrast to novel execution attempts, which fall outside the bounds of our expectations.
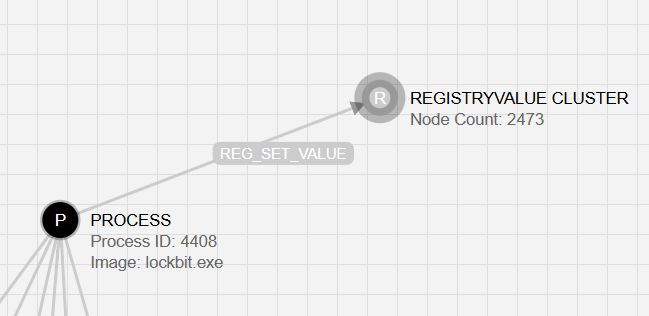
Beyond interactions with memory, the graphs resulting from these notifications included several common indicators of ransomware activity that make these execution attempts appear more novel. Specifically, the `lockbit.exe` process was responsible for 2,473 writes to registry values in very specific key paths. We can observe these actions in the graph by following the `REG_SET_VALUE` edge, pictured below, to the `RegistryValue` cluster, which hides the thousands of individual nodes that represent the keys written to.
Downloading the collection and parsing the `SET_REGISTRY_VALUE` events shows that there were three main goals of all of this registry interaction:
- Setting a default icon for the extension used for encrypted files
\REGISTRY\MACHINE\SOFTWARE\Classes\.X6XApzKPXREGISTRY\MACHINE\SOFTWARE\Classes\X6XApzKPX\DefaultIcon
- Changing the desktop background to display a ransom message
- Key:
\REGISTRY\USER\S-1-5-21-3225754585-1743688647-882330924-1001\Control Panel\Desktop - Value: WallPaper
- Type: 1 (REG_SZ)
- New Data:
C:\ProgramData\X6XApzKPX.bmp
- Key:
- Establishing itself as the owner of any locked files to release those locks and proceed with encryption
\REGISTRY\USER\S-1-5-21-3225754585-1743688647-882330924-1001\Software\Microsoft\RestartManager\Session0000- Unique value names:
- 'Owner'
- 'RegFiles0000'
- 'RegFilesHash'
- 'Sequence'
- 'SessionHash'
- Disabling and restricting access to hundreds of ETW channels in an attempt to limit the collection of security-relevant telemetry
\REGISTRY\MACHINE\SOFTWARE\Microsoft\Windows\CurrentVersion\WINEVT\Channels\<CHANNEL_NAME- Unique value names:
- ‘ChannelAccess’
- ‘Enabled’
The goal here is not to enumerate every registry interaction and process command line argument associated with a subset of known malware samples, but rather to use these data points as a reason why a specific execution of private memory is distinct from those that share similar patterns of memory interaction. Execution is the gateway to these more familiar indicators of compromise
While not discussed in this post, the profiles of known-benign classes of false positives, such as native .NET applications and JIT compilation engines, are also extremely informative for triaging Prelude alerts, as they provide a clear definition of what is and is not novel. Future blog posts will discuss why these kinds of software execute private memory, how to identify them, and how to distinguish between malware’s execution of private memory in detail.
What we learned
The execution of private memory continues to be a reliable chokepoint for attackers, even outside of C2 agents being initially loaded into memory or loading post-exploit tooling themselves. While execution of memory seems to be common across many stages of a common operation, their repetition is often guaranteed because of the structural part they play in modern toolkits.
Just like stagers and PIC loaders, a heap-based library loader is forced to use virtual memory in a consistent pattern every time the program runs. A stage zero C2 agent loader has to run on every compromised system to start the agent. That C2 agent’s COFF loader has to execute multiple tools in memory to move towards an objective. While some variation can be introduced to allocation, write, and execution primitives along the way, the collective context of the system objects that were involved in these operations creates a pattern whose novelty compounds with repetition. The same concept applies in reverse, where classes of false positives become clear over time due to the lack of novel patterns for commonly seen images.
The Prelude agent begins with a simple detection strategy that focuses exclusively on the execution of private memory, and then builds upon the larger context of that execution in a way that describes provenance. As we collect more data, our understanding of what out-of-context means will become both more broadly applicable and based on increasingly specific patterns of behavior. Analysts will be introduced to more traditional indicators of compromise – such as file, registry, and network interactions – through the detection of novel private memory execution. This allows us, and our customers, to move beyond an incomprehensible rule base filled with brittle predictions about tradecraft, ensuring that nothing is left undetected purely because of volume tradeoffs or the inability to make high-level telemetry target low-level behavior.
The LockBit sample explored in this post is an interesting example of why offensive development is often a matter of tradeoffs. In an attempt to evade static analysis and manual reverse engineering workflows, the author of this encryptor actually made its use of private memory extremely suspicious to a detection strategy that doesn’t focus on those approaches. In other words, successful evasion in one direction increased the likelihood of detection in another. We hypothesize that the specifics of memory interaction are a blind spot for many malware authors who are not attuned to how security software can inspect private memory and leverage hardware telemetry at scale.